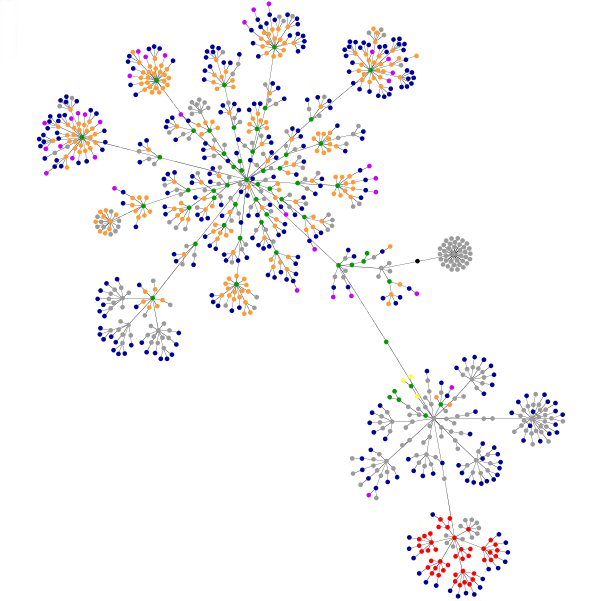
This is a representation of this web page:

The legend is as follows:
blue: for links (the A tag)
red: for tables (TABLE, TR and TD tags)
green: for the DIV tag
violet: for images (the IMG tag)
yellow: for forms (FORM, INPUT, TEXTAREA, SELECT and OPTION tags)
orange: for linebreaks and blockquotes (BR, P, and BLOCKQUOTE tags)
black: the HTML tag, the root node
gray: all other tags
Apparently my blog’s main page is a lot more complicated than Google’s main page.
The tool that generated this is fun to mess around with, to see some of the structure of other pages, but perhaps even more fun because you can watch the tree building, and the physics engine move the nodes around to a maximum separation.
(I’m pretty sure that next time I’m bored I’m going to use the physics and graphics tools that are used here–which all appear to be FOSS–and write a new version of the zombie simulation.)

